チャートを見ると、値動きには天井と底があるかのように思える境界、サポートラインとレジスタンスライン。
これらを数学的に検出する方法を紹介。
The Breakout Bulletin
目次
ブレイクアウト会報
The following article was originally published in March 2003 issue of The Breakout Bulletin.
以下の記事はブレイクアウト会報の2003年3月号に掲載されたものです。
Quantifying Chart-based Support/Resistance Levels
チャート上のサポートレベルとレジスタンスレベルの定量化
- A common distinction in trading is between systematic and discretionary trading methods.
Systematic traders use hard and fast rules that are typically computerized in the form of one or more trading systems.
Discretionary traders, on the other hand, don’t use trading systems.
While they have trading rules and methods, they haven’t codified those rules into a computerized trading system.
I’ve always found this distinction to be somewhat arbitrary.
One of the tenets of good trading is to have well defined methods.
Whether you computerize those methods into a trading system or choose to manually implement certain aspects of your approach, you still have something that could reasonably be called a “system.”
In fact, I’d go as far as to say that most discretionary methods are just trading systems yet to be programmed.
A trader may be “discretionary” only because his approach seems too complicated to program.
システムトレードと裁量トレードとの区別として一般的に言われていることがある。
システムトレーダーは厳密ですばやく行えるルールを使用している。
そのルールは典型的には1つもしくはそれ以上のトレーディングシステムの形としてコンピュータで処理されている。
その一方で裁量トレーダーはトレーディングシステムを使用していない。
彼らはトレーディングのルールと手法をもっているのだが、それらをコンピュータで処理されたトレーディングシステムとして作り上げていない。
私はいつもこの区別の仕方が多少独断的であると思うのである。
よいトレーディングであるという見解の1つはうまく定義された手法をもっていることである。
あなたがこの手法を1つのトレーディングシステムとしてコンピュータで処理しているのか、あなたの手法の信頼できる部分を手作業で実行することを選んでいるのか、どちらであっても問題なく“システム”とよぶことのできるものをあなたはもっていることになる。
実際、ほとんどの裁量的な方法がまだプログラム化されていないと言うことができる。
トレーダーが彼のトレーディングの手法があまりに複雑でプログラム化できないという理由だけで、“裁量的”なのだろう。
- One aspect of trading that can frustrate attempts at programming is chart patterns.
Reading chart patterns, such as triangles and head and shoulder patterns, is said to be more art than science.
If you have a trading approach based on chart patterns, you’re probably a discretionary trader, if only because it’s complicated to program a system to recognize a chart pattern.
プログラミング化を試みて挫折するトレーディング手法の1つがチャートパターンである。
トライアングルやヘッドアンドショルダーなどのようなチャートパターンを読むことは科学的というより芸術的であるといえる。
もしあなたがチャートパターンを基にしたトレーディング手法をもっていて、そのチャートパターンを認識するシステムをプログラム化することが複雑であるという理由があるだけで、あなたはおそらく裁量トレーダーなのである。
- Several months ago I was studying support and resistance levels for day trading the E-mini S&P.
After scanning numerous intraday charts to locate these price levels visually, an algorithm occurred to me for identifying these support and resistance prices.
This month, I’ll show how this algorithm works and how to program it in TradeStation’s EasyLanguage.
数ヶ月前、私はE-mini S&Pのデイトレーディングのためにサポートとレジスタンスのレベルについて研究していた。
これらのプライスレベルを視覚的に発見するために膨大な日中(イントラデイ)チャートをくまなく観察した後、これらのサポートとレジスタンスプライスを決定するための1つのアルゴリズムについての考えが私の頭に浮かんだ。
今回、私はこのアルゴリズムがどのように働き、トレードステーションのイージーランゲージでそれをどのようにプログラム化したのかを紹介する。

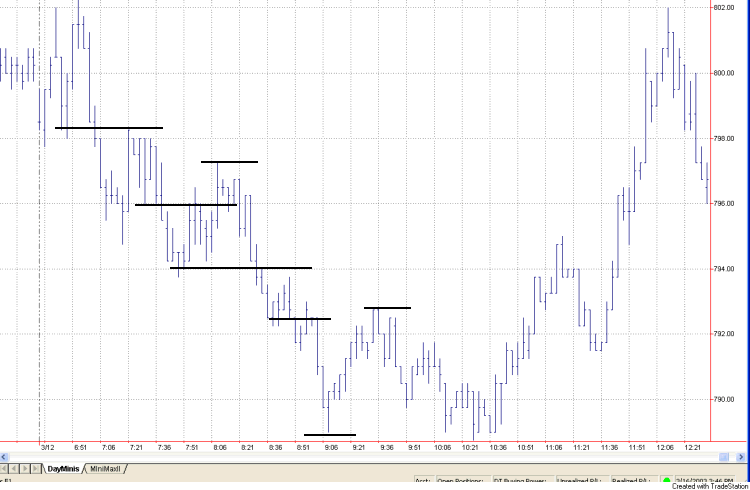
- Fig. 1 A 3 minute chart of the March E-mini S&P 500 showing several support and resistance levels.
図1.E-mini S&P500の3分チャートに表示したいくつかのサポートおよびレジスタンスレベル
- Consider Fig. 1. I’ve drawn several horizontal lines by hand to suggest the kind of short-term support and resistance levels I have in mind.
You might look for these price levels if you’re trying to capture a few points of profit per trade.
For example, you might try to sell short at the resistance level during a downtrend and cover at the support level.
Similarly, in a up trend, you might try to buy at the support level and sell at the resistance level.
図1について考えてみる。
私は自分の考えていた短期のサポートとレジスタンスレベルを説明するために数本の水平ラインを手で描いた。
トレードで利益の出せるいくつかのポイントをうまく表現しようとするならば、あなたはこれらのプライスレベルを探すかもしれない。
たとえば、下降トレンド中にレジスタンスレベルでショートエントリーしようとしたかもしれない。
同じように上昇トレンド中にサポートレベルで買い、レジスタンスレベルで売ろうとしたかもしれない。
- The logic I came up with to systematize the identification of these levels is pretty straight-forward.
As each price bar is completed, I look for the most logical location for support and the most logical location for resistance relative to the close of the most recently completed bar.
Since we are focusing on intraday data, which, in actual day trading, is evolving in real time, these support/resistance locations may change from bar to bar.
私が思いついたこれらのレベルの識別を機械的に行うためのロジックは、かなりわかりやすいものである。
各プライスバーが完成したときに、私はもっとも論理的なサポートレベル用の位置とレジスタンスレベル用の位置を、できたばかりのプライスバーの終値に関連付けて探す。
われわれは日中データに注目しているため、実際のデイトレーディングではこの作業はリアルタイムに進行し、サポートとレジスタンスレベルの位置はバーからバーへと変化する。
- To identify the locations of support and resistance relative to the close, I scan all price levels within X points of the close over the last N bars. At each price level, imagine a horizontal line extending back from the current bar over the last N bars.
Our goal is find the price level at which the horizontal line best fits the last N bars.
I use a least-squares fitting method.
At each price bar, determine whether the high or low of the bar is closest to the line and add the square of the difference between that price and the price level of the line to a running sum.
This calculation is repeated for each of the N bars closest to the current bar to form the “sum of squares.
” Ignore price bars that are farther away from the line than Y points in order to avoid skewing the sum by these “outlier” prices.
The whole process is repeated for each price level within X points of the current close.
終値に関連付けたサポートとレジスタンスレベルの位置を識別するために、私は過去N本のバーの終値のXポイント以内のすべてのプライスレベルをくまなく調べる。
各プライスレベルにおいて、現在のバーから過去N本のバーまでさかのぼって水平ラインを伸ばしたものを想像してほしい。
我々の目標は過去N本のバーにもっともフィットする水平ラインのプライスレベルを発見することだ。
私はこれに最小2乗法を使用する。
それぞれのプライスバーにおいてバーの高値または安値のどちらがラインにもっとも近いのかを決定し、そのプライスと水平ラインのプライスレベルの差の2乗を“累積”へと加える。
現在のバーに最も近いN本のバーのそれぞれで、この計算が“2乗の合計(累積)”を作るために繰り返される。
Yポイント以上ラインから離れているプライスバーは、この合計値をゆがめるのを避けるために、“関係ないもの”として無視する。
すべてのプロセスは現在の終値からXポイント以内の各プライスレベルで繰り返し行われる。
- The resistance level is then the price above the current bar’s high for which the sum of squares is smallest.
The support level is the price below the current bar’s low for which the sum of squares is smallest.
レジスタンスレベルは現在のバーの高値より高いプライスで、2乗の合計が最も小さくなるものである。
サポートレベルは現在のバーの安値より低いプライスで、2乗の合計が最も小さくなるものである。

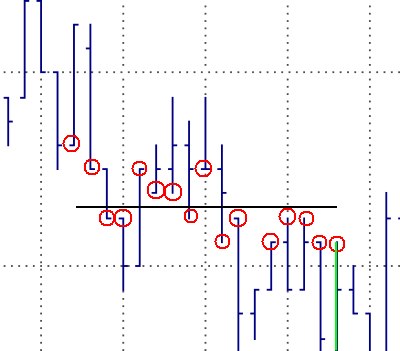
- Fig. 2. Fitting a line to the price bars.
図2.プライスバーにラインを合わせている様子
- Fig. 2. illustrates the sum-of-squares process for a given price level. The horizontal line is a potential resistance level for the price bar colored green.
The prices used in the sum of squares calculation are circled in red.
Notice that one of the bars does not have a red circle on either its high or low.
This is because the closest price on the bar is farther than Y points from the horizontal line.
The sum of squares for this horizontal price level is the sum of the squares of the distances between the circled prices and the horizontal line.
図2は 与えられたプライスレベルで2乗の積算の工程を表したものである。
水平ラインは緑色のプライスバーの潜在的なレジスタンスレベルである。
2乗の積算の計算に使用されたプライスは赤い丸で表示した。
高値と安値のどちらにも赤い丸のないバーが1つあることに気づくだろう。
これはこのバー上の最もラインに近いプライスが水平ラインからYポイント以上に大きく離れているためである。
水平プライスレベルのための2乗の合計は、丸で囲まれたプライスと水平ラインとの間の距離を2乗したものの合計である。
- I programmed the calculation of the support and resistance levels into an EasyLanguage function called SupRes2. The EasyLanguage code is shown below.
私はこのサポートとレジスタンスレベルの計算をイージーランゲージ関数としてプラグラム化し、SupRes2と名づけた。イージーランゲージのコードは次のとおりである。
{

  Function: SupRes2 ("Support/Resistance")

  Locate the nearest price levels of support and resistance.


  Returns: Average of support and resistance levels; Also, the

  support and resistance levels are returned through the argument

  list.


  Michael R. Bryant

  Breakout Futures

  www.BreakoutFutures.com

  Copyright 2003 Breakout Futures

  Feb 24, 2003

}

  Input: NBars     (NumericSimple),  { # bars to lookback in search }

         PriceRnge (NumericSimple),  { # points to examine above/below close }

         PFilter   (NumericSimple),  { Include high/low within PFilter points }

         MinPoints (NumericSimple),  { min # points for a fit }

         SupPrice  (NumericRef),     { located support price }

         ResPrice  (NumericRef);     { located resistance price }


  Var:  iPrice     (0),     { price at current level }

        DtoLow     (0),     { distance from line to low }

        DtoHigh    (0),     { distance from line to high }

        Sum        (0),     { sum of weights }

        NormSum    (0),     { normalized sum }

        MinSum     (999999),{ max sum of weights }

        NPoints    (0),     { # points in sum }

        SupportP   (0),     { best support price }

        ResistP    (0),     { best resistance price }

        NPInc      (0),     { number of price increments above/below close }

        istart     (0),     { first increment to start at }

        ip         (0),     { loop counter of price increments }

        ib         (0);     { loop counter for bars }


  NPInc = PriceRnge/(MinMove/PriceScale);

  istart = IntPortion(NPInc/3);


  { Search for resistance; loop over prices above close }

  MinSum = 999999;

  ResistP = MaxList(High, ResPrice);

  For ip = istart to NPInc Begin

     iPrice = Close + ip * (MinMove/PriceScale);

      Sum = 0;

      NPoints = 0;


      { Loop over bars }

      For ib = 1 to NBars Begin


          { Add up sum of squares of distances to price line }

          DtoLow = AbsValue(L[ib] - iPrice);

          DtoHigh = AbsValue(H[ib] - iPrice);

          If DtoLow <= DtoHigh and DtoLow <= PFilter then Begin
             NPoints = NPoints + 1;
             Sum = Sum + Square(DtoLow);
          end
          else If DtoHigh < DtoLow and DtoHigh <= PFilter then Begin
             NPoints = NPoints + 1;
             Sum = Sum + Square(DtoHigh);
          end;

    end; { loop ib }

    { Record iPrice if sum is lowest so far }
    If NPoints >= MinPoints then Begin

       NormSum = SquareRoot(Sum/NPoints);

       If NormSum < MinSum then Begin
          MinSum = NormSum;
          ResistP = iPrice;
       end;
    end;
  end; { loop ip }

  ResistP = MaxList(High, ResistP);   { make sure resistance >= high }


  { Search for support; loop over prices below close }

  MinSum = 999999;

  SupportP = MinList(Low, SupPrice);

  For ip = istart to NPInc Begin

     iPrice = Close - ip * (MinMove/PriceScale);

      Sum = 0;

      NPoints = 0;


      { Loop over bars }

      For ib = 1 to NBars Begin


          { Add up sum of squares of distances to price line }

          DtoLow = AbsValue(L[ib] - iPrice);

          DtoHigh = AbsValue(H[ib] - iPrice);

          If DtoLow <= DtoHigh and DtoLow <= PFilter then Begin
             NPoints = NPoints + 1;
             Sum = Sum + Square(DtoLow);
          end
          else If DtoHigh < DtoLow and DtoHigh <= PFilter then Begin
             NPoints = NPoints + 1;
             Sum = Sum + Square(DtoHigh);
          end;

    end; { loop ib }

    { Record iPrice if sum is lowest so far }
    If NPoints >= MinPoints then Begin

       NormSum = SquareRoot(Sum/NPoints);

       If NormSum < MinSum then Begin
          MinSum = NormSum;
          SupportP = iPrice;
       end;
    end;
  end; { loop ip }

  SupportP = MinList(Low, SupportP);   { make sure support <= Low }

  SupPrice = SupportP;
  ResPrice = ResistP;

  SupRes2 = (SupportP + ResistP)/2.;
- I also created an indicator based on the SupRes2 function to plot the support and resistance levels.
The code for the indicator is shown below.
私はまたSupRes2関数を基にしてサポートレベルとレジスタンスレベルをチャートに描くインディケーターも作成した。
このインディケーターのコードは次のとおりである。
{

  Indicator: SupRes Indicator-2

  Plot the support and resistance given by the SupRes2 function.


  Michael R. Bryant

  Breakout Futures

  www.BreakoutFutures.com

  Copyright 2003 Breakout Futures

  Feb 24, 2003

}

 Inputs: NBars     (30),             { # bars to lookback in search }

         PriceRnge (3),              { # points to examine above/below close }

         PFilter   (1.0),            { points this close to line }

         MinPoints (4);              { need at least this many points in fit }


 Var:    SupPrice  (C),              { located support price }

         ResPrice  (C);              { located resistance price }


 { Call SupRes function to find nearest support/resistance }

 Value1 = SupRes2(NBars, PriceRnge, PFilter, MinPoints, SupPrice, ResPrice);

 Plot1(SupPrice, "Support");

 Plot2(ResPrice, "Resistance");
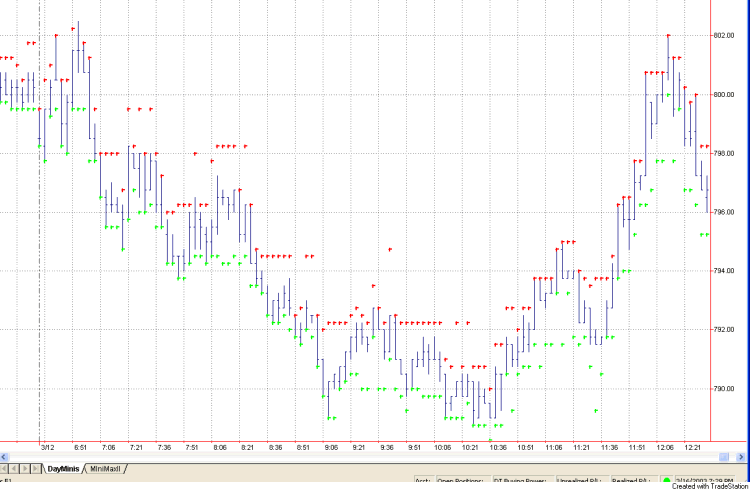
- In Fig. 3, I show how the indicator works for the same price chart shown in Fig. 1.
I used the following input parameter values: 30, 2.25, 0.75, 4.
The support prices are in green and the resistance levels in red.
During downtrending markets, the support levels tend to stay close to the price bar lows because none of the nearby price bars have prices lower than the most recent bar's low.
Similarly, in uptrending markets, the resistance levels stay near the highs.
The SupRes2 function could be employed in a trading system in a number of different ways, such as (1) to identify the trend based on whether support and resistance levels are rising or falling, and (2) to trigger entries and/or exits at the identified support and resistance levels.
図3では、図1で見せたのと同じプライスチャートにインディケーターがどのように機能するのかを描いた。
私は次の値を入力パラメーター数値に用いた。:30,2.25,0.75,4
サポートレベルのプライスが緑色、レジスタンスレベルが赤色である。
マーケットが下降トレンドにある時、サポートレベルはプライスバーの安値近くにある傾向がある。
なぜなら最近のバーの安値の大部分よりも低い値をもったプライスバーが近くに(30本バー以内に)ないためである。
同じように、マーケットが上昇トレンドにある時、レジスタンスレベルは高値近くにある。
SupRes2関数はいくつかの異なる方法でトレーディングシステムに使うことが可能だろう。
(1)サポートとレジスタンスレベルが上昇しているのか下降しているのかということに基づいてトレンドを識別する、
(2)エントリーと(または)エグジットのトリガーとして識別されたサポートとレジスタンスレベルを使う、
といったように、である。

- Fig. 3. SupRes Indicator plotted on a 3 minute chart of E-mini S&P data.
図3.E-mini S&Pの3分チャートデータに描いたSupRes2インディケーター
- The SupRes2 function illustrates how a visual task like identifying a support or resistance level on a
price chart can be systematized.
I'll leave it to you to incorporate these levels into a trading system.
マーケットプライスの値動きの大きさ”ボラティリティ”は変動する。
ボラティリティを計測するフィルターを作成し、その利用について考えてみた。
Was January Unusual?
1月は特別なのか?
- I spoke with several traders in February who remarked that the market seemed to be trading differently (and not "good" different).
The consensus seemed to be that the worries about war with Iraq were affecting the markets and making them more difficult to trade.
This made me wonder if there was a way to quantify the apparent changes in market behavior.
Towards this end, I looked at several indicators that represent market dynamics.
私は「2月にマーケットがいつもとは違った(よくない意味で違った)トレードをされているように思える」と指摘する数人のトレーダーと話をした。
この意見は、「米国とイラク間の戦争についての心配がマーケットに影響しトレードをすることを難しくしている、ということのようである。
このことは私にマーケットの反応の目に見える変化を定量化する方法があるかどうかを考えさせた。
この結論に向かって、マーケットの力学を知らせるいくつかのインディケーターを観察した。
False Breakout Indicator
偽ブレイクアウトのためのインディケーター
- To get a better feel for the extent of false breakouts recently, I came up with an indicator that quantifies the size of the false breakouts, if any, on each bar.
I define a false breakout as the amount the market moves in the direction opposite to the direction in which the bar eventually closes or the amount the market moves beyond where it eventually closes.
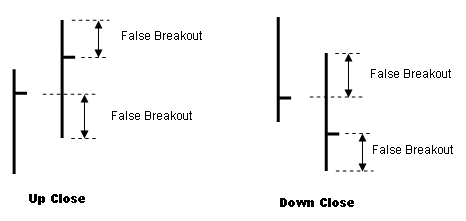
Specifically, on an up bar, I define a false breakout as the amount that the market drops below the prior close or rises above the current close, whichever is larger.
最近の偽ブレイクアウトの程度をよりはっきりと感じとるために、各バーで偽ブレイクアウトの大きさを定量化するインディケーターを作成した。
私は偽ブレイクアウトをバーが始値から終値への方向とは逆にマーケットが動く大きさ、または同じ方向に終値よりオーバーしてマーケットが動いた大きさとして定義した。
具体例を挙げると、陽線となったバーでは、私はマーケットが1つ前のバーの終値より現在のバーで落下した大きさ(1つ前のバーの終値から現在のバーの安値の差)または現在のバーの終値より上昇した大きさ(現在のバーの高値から現在のバーの終値の差)の、どちらか大きいものを偽ブレイクアウトとして定義した。
- Similarly, on a down bar, the false breakout is the amount the market rises above the prior close or drops below the current close, whichever is larger.
This is illustrated in Fig. 1.
A bar that closes at the high or low of the day and has no trading overlapping the prior close would have a zero value of the false breakout.
To create the indicator, I plot the raw value on each bar normalized by the average true range and the moving average of this value.
("Range" is simply the bar's high minus it's low; "true range" is similar but takes gaps into account.)
同様に陰線のバーでは、1つ前のバーの終値から現在のバーが上昇した大きさ(現在のバーの高値から1つ前のバーの終値の差)または現在のバーの終値から落下した大きさ(現在のバーの終値から現在のバーの安値の差)、このどちらか大きいものとする。
これを図にしたものが図1である。
バーがその日の高値または安値で終了し、1つ前の終値にトレードのないバーは偽ブレイクアウトの値は0である。
インディケーターを作るために、私は平均トゥルーレンジによって標準化した各バーの値とこの値の移動平均値をグラフに記した。
(“レンジ”はバーの高値から安値の単なる差である。“トゥルーレンジとは”レンジ“に似てはいるが、違いを考慮したものである。)

-
Fig. 1 Defining "false breakouts" for the FalseBreakout indicator.
図1.偽ブレイクアウトインディケーターの「偽ブレイクアウト」の定義
- The EasyLanguage code for the FalseBreakout indicator is shown below.
偽ブレイクアウトインディケーターのイージーランゲージコードは次に示した。
{

  Indicator: FalseBreakout

  This indicator calculates the size of the false breakout

  on each bar (if any). It normalizes the result by the

  average true range and plots the raw value plus the

  average.
Michael R. Bryant
Breakout Futures
www.BreakoutFutures.com
Copyright 2003 Breakout Futures
Feb 11, 2003
}
Input: N (10);
Var: FBO (0),
AFBO (0);
If C >= C[1] then
FBO = MaxList(H - C, C[1] - L)
else
FBO = MaxList(H - C[1], C - L);
FBO = FBO/Average(TrueRange, N);
AFBO = Average(FBO, N);
Plot1(FBO, "False B/O");
Plot2(AFBO, "Ave B/O");