完成したトレーディングシステムのバックテストから、勝ち負けに一定のパターンをみつけ、それをシステムに指標として追加したらどうなるかという試み。
The Breakout Bulletin
ブレイクアウト会報
The following article was originally published in the September 2002 issue of The Breakout Bulletin.
以下の記事はブレイクアウト会報の2002年9月号に掲載されたものです。
Exploiting Trade Dependency
トレード依存度指標の利用
-
I recently discovered a pattern to the trades for MiniMax II that can be exploited to increase the profitability of the system. In addition to being of interest to MiniMax traders, this presents a good opportunity to discuss trade dependency.
私は最近システムの収益性をあげるために使うことのできるMiniMax IIにおけるトレードパターンを発見した。
MinMaxを使用しているトレーダーが興味をもつことであり、これはトレード依存度について議論するよい機会である。
-
It’s often useful to think of financial markets in statistical terms. For example, the trades produced by a trading system can be represented by a statistical distribution, which shows the frequency of occurrence of trades of different sizes. For example, you might find that 5% of trades are between $200 and $300, 7% are between $301 and $400, etc. Another statistical concept that is sometimes useful in trading is trade dependency. With trading systems, dependency refers to the relationship between consecutive trades. If a loss is more likely to follow a win than a loss, for example, there is negative dependency. This means that wins tend to follow losses and losses tend to follow wins. Positive dependency means that wins tend to follow wins and losses tend to follow losses.
統計的項目中の金融マーケットについて考えることは、時々役に立つ。
例えばトレーディングシステムによるトレードを、トレードの発生頻度をサイズの違い別に示す統計分布によって表すことができる。
例えばトレードの5%が$200から$300の間に、7%が$301から$400の間にある、などがわかるだろう。
トレードで時々役に立つもう1つ別の統計的コンセプトがトレード依存度である。
依存度はトレーディングシステムにより続けて行ったトレード間の関係を参照する。
例えばもし1敗が、1敗よりも1勝の後に続いてよく起きるように思えるなら、それはネガティブ依存性があるといえる。
これは勝ちが負けの後に起き、負けが勝ちの後に起きる傾向があることを意味する。
ポジティブ依存性は勝ちが勝ちの後に起き、負けが負けの後に起きる傾向があることを意味する。
-
In most cases, there is no statistically significant dependency among trades. In this respect, most trading systems are analogous to flipping a coin. The odds of a coin landing heads up is 50-50, regardless of how many times in a row you get tails. Each coin flip is independent of every other one. Intuitively, it may feel like the odds of getting heads is higher if you’ve landed 10 tails in a row, but the coin doesn’t know that you’ve landed 10 tails in a row. With each flip of the coin, you still have a 50-50 chance of getting heads. Most trading systems produce a similar lack of dependency. Whether the next trade is a win or a loss doesn’t depend on the previous trade. If your system historically has 53% winners, the odds of the next trade being a winner are 53%, regardless of whether you had 10 losses in a row or 10 winners in a row.
ほとんどのケースでは、トレードについて統計的に意味のある依存性はない。
この観点から、ほとんどのトレーディングシステムはコイン投げに似ている。
コイン投げで表が出る確率は、あなたが連続して裏を何回出したかに関わらず、50-50(半々=50%)である。
それぞれのコイン投げ1回は他の回のコイン投げから独立している(依存しない)。
もし連続して裏を10回出したら、次にコインが表になる確率は高いとあなたは直感的に感じるだろう。
しかしコインはあなたが連続して10回裏を出したことは知らない。
コイン投げの各回で表を出すチャンスは半々のままである。
ほとんどのトレーディングシステムは同様の依存性の欠如を作り出す。
次のトレードが勝つか負けるかは前のトレードに依存しない。
もしあなたのシステムが過去の実績が53%の勝率であれば、連続して10回負けても勝ってもそれに関係なく次のトレードで勝つ確率は53%である。
しかし例外はある。
私はトレード依存度と呼んでいるインディケータを作った。
(http://www.breakoutfutures.com/Downloads.htm
ここから無料でダウンロードできる)
このインディケータは、トレーディングシステムが行った最後のN番目のトレードへの統計的に意味のある依存性があるかどうかを決定するための「連検定(統計学専門用語)」と呼ばれる統計テストを使用している。
トレードの長い実績の中で意味のある依存性は何もないと思われる一方で、時間から時間へと現れる依存性の期間がある可能性がある。
トレード依存度インディケータはこれらの例外をみつけることができる。
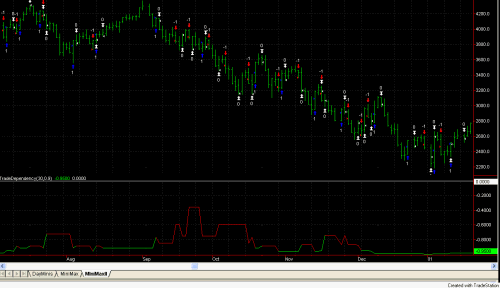
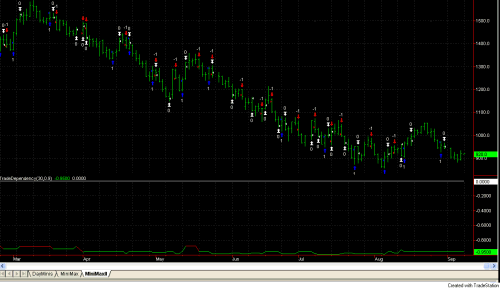
最近私がこれをMiniMax IIに書き込んだとき、N=30(言い換えると過去30回以上のトレード)を使ったE-miniナスダックで意味のあるネガティブ依存性を発見した。次の図1と図2をみてほしい。

-
Fig. 1. The trade dependency indicator is plotted at the bottom of the price chart for the E-mini Nasdaq during late 2001. The white horizontal line is the zero (neutral) line indicating no dependency. Where the line is colored red the dependency is not significant. Where the line is colored green there is significant negative dependency.
図1.トレード依存度インディケータは2001年後半のE-miniナスダックのプライスチャートの下に書かれている。
白い横軸は依存性がないことを示すゼロ(中性)ラインである。
ラインが赤い部分では依存度は重要ではない。
ラインが緑色の部分ではかなりのネガティブ依存性がある。

-
Fig. 2. Trade dependency is plotted for the E-mini Nasdaq during recent months. Notice that the line is mostly green, indicating persistent negative dependency that is statistically significant.
図2.最近数ヶ月のE-miniナスダックのトレード依存度。
ラインがほとんど緑色であることに注目してほしい。
これは持続性のある統計的にかなりのネガティブ依存性を示している。
-
Recall that negative dependency means that winners tend to follows losses, and vice versa. Provided the dependency persists long enough, it can be exploited. I tested various methods to vary the position size based on the prior trade. The most effective method I discovered was to decrease the fixed fraction slightly after a win and increase it after a loss provided the Trade Dependency indicator was showing significant negative dependency. In particular, if there is no significant dependency (red line), I keep the fixed fraction at 4%. This means I risk 4% of my account equity on the next trade. However, if there is significant negative dependency (green line) and the last trade was a win, I only risk 3% on the next trade. If there is significant negative dependency and the last trade was a loss, I risk 6% on the next trade.
ネガティブ依存性が勝ちは負けの後に続く傾向があることを意味すること、そしてその逆も思い出してほしい。
依存性は充分長く持続すれば、それは利用することができる。
私は前に行ったトレードのポジションサイズを変更するために様々な方法をテストした。
私の発見した最も効果的な方法は、
トレード依存度インディケータがかなりのネガティブ依存性を示しているときに、1勝のあと売買の固定比率をわずかに減らし、1敗の後では増やす
ことであった。
詳しく言うと、もし依存性(赤色の線)がほとんどなければ固定比率を4%で維持する。
これは私が次のトレードに口座資産の4%のリスクを負うことを意味している。
しかしもしかなりのネガティブ依存性(緑色のライン)があり前回のトレードが1勝ならば、私は次のトレードでは3%のリスクしかとらない。
もしかなりのネガティブ依存性があり前回のトレードが1敗ならば、私は次回のトレードで6%のリスクをとる。
-
Applying these rules to the available history of MiniMax II applied to the E-mini Nasdaq (9/99 to present) results in a final equity of $3.3M on a starting account balance of $50K with a worst-case drawdown of 18.6%. If the fixed fraction is kept at 4% regardless of trade dependency, the final equity is $1.3M with a worst-case drawdown of 20%. So by exploiting trade dependency, we obtain a greater return with a smaller drawdown. I tried different size adjustments to the fixed fraction, but these numbers (3% after a win; 6% after a loss) worked best. Notice that I’m not suggesting you do anything as dramatic as skipping the next trade after a win or doubling up after a loss. That kind of crude adjustment doesn’t seem to work well historically. The more subtle approach that I’ve outlined is preferable. The idea is to make small adjustments to your position size based on trade dependency and only when the dependency has been statistically significant over the last 30 trades.
E-mini Nasdaq(99年9月現在)用MiniMax IIの利用可能な過去データにこれらのルールを適用すると、開始時の口座残高が5万ドルでは最終資産33万ドル最大ドローダウン18.6%という結果となる。
もし売買の固定比率がトレード依存度に関わらず4%であれば、最終資産13万ドル、最大ドローダウン20%となる。
つまりトレード依存度を利用することで我々は大きな収益とより少ないドローダウンを手にするのである。
私は売買の固定比率の値の調整をしてみたが、これらの数値(1勝の後で3%、1敗の後で6%)が最もよい結果となった。
ここで、1勝の後に次のトレードを行わない、または1敗の後に枚数を倍にするような大げさなことをしろと提案しているわけではないことに注意してほしい。
この種の粗い調整は過去データ上でうまく機能していないように私には思える。
しかし私が概略を上記したより明敏な方法は選ぶのに値するものである。
このアイデアは、過去30回以上のトレードにおいて統計的にかなり依存性があるときにだけトレード依存度に基づいてポジションサイズを少し調整することである。
-
I should also point out that there are periods of significant dependency with MiniMax II on the E-mini S&P, but the dependency doesn’t seem to last long enough to profitably exploit.
またE-mini S&PにおいてMiniMax IIがかなりの依存性がある期間が存在することを指摘すべきだが、しかし依存性が有益に利用できるほど十分な期間ほど長く継続しているようには思えないのである。
本題終わり