-
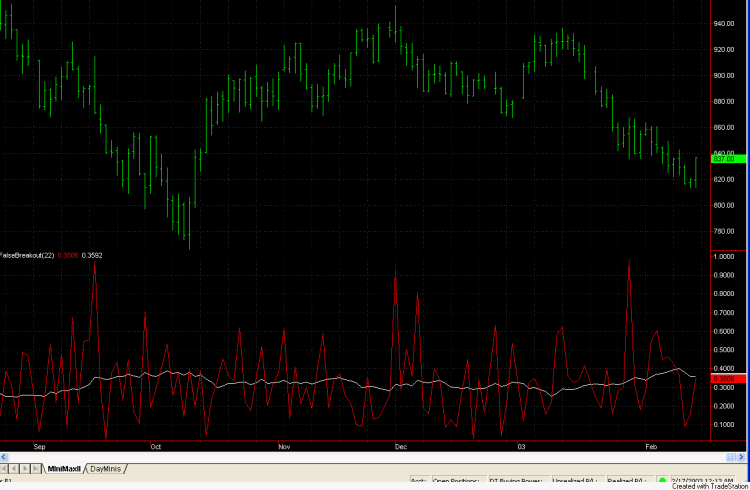
Fig. 2 shows what this looks like on daily bars for the E-mini S&P over recent months.
While the daily value is quite volatile, the average value doesn’t change much over time, suggesting that there have been no more false breakouts recently than in the past.
While my subjective impression was that there were more false breakouts in January than usual, this is not supported by the false breakout indicator.
図2は最近の数ヶ月のE-mini S&Pの日足バーのチャートである。
毎日の値動きが激しいのに反して平均の数値は時間とともにそれほど変化していない、これは過去より最近は偽のブレイクアウトが多くないことを示している。
私の主観的な印象が1月に偽ブレイクアウトが多いということに反して、偽ブレイクアウトインディケーターはそうは示していない。

- Fig. 2. FalseBreakout indicator plotted on a chart of daily bars of the E-mini S&P.
図2.E-mini S&Pの日足チャートに描かれた偽ブレイクアウトインディケーター。
Trendiness Indicator
トレンド度インディケーター
目次
- A common way to define the strength of the market trend is to divide the absolute value of the change in price by the average true range over the past N bars.
This tells us how much the market has moved relative to the average true range.
A market that’s moved three times the average true range over the last month has a stronger trend, for example, than one that’s moved only 1.5 times the average true range.
マーケットのトレンドの強さを定義する一つのよくある方法は、プライスの変化の絶対値を過去N本のバーの平均トゥルーレンジで割ることである。この方法は平均トゥルーレンジに対してマーケットがどれだけ動いたのかを教えてくれる。
例えば先月の平均トゥルーレンジの3倍動いたマーケットは1.5倍動いたマーケットよりも強いトレンドをもっていることになる。
- In EasyLanguage, this can be written as follows:
イージーランゲージではこれは次のように書くことができる。
Input: NBars (30);
Value1 = AbsValue(C – C[NBars])/Average(TrueRange, NBars);
Plot1(Value1, “Trendiness”);
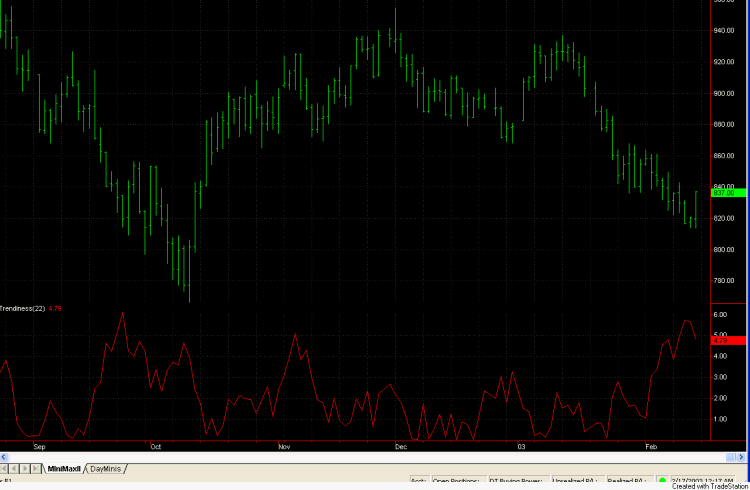
- In Fig. 3, this indicator (“Trendiness”) is plotted on a chart of daily E-mini S&P data using a look-back period of 22 days, the average number of trading days in a month. The indicator looks particularly flat during December and January, two difficult months for the short-term trading approach of the MiniMax II system. In fact, the indicator only briefly got above a value of 3 over this 2-month period.
The last time the indicator was consistently this low was over the Dec-Jan period one year earlier. Interestingly, MiniMax II was modestly profitable during that period.
The lack of trend strength may be a distinguishing factor in the recent Dec-Jan trading period.
However, it’s not entirely clear that lack of trend strength correlates strongly with lack of good trading opportunities.
図3では、このインディケーター(トレンド度)はE-mini S&Pデータの日足チャート上に描かれており、look-back期間に1月のトレード日数の平均である22日を使っている。
このインディケーターは、12月から1月にかけて特に平坦に見える。
MiniMax IIの短期トレード法にとって、これらは難しい2ヶ月間である。
実際、このインディケーターはこの2ヶ月間では3以上の数値を出したのは少しの間しかなかった。
インディケーターが底値を維持した最近の期間は1年前の12月から1月にかけてである。
面白いことにMiniMax IIはこの期間で少し利益を出していた。
トレンドの強さが弱いことが最近の12月から1月の期間を識別する要素であるかもしれない。
しかしながら、トレンドの強さが弱いことが勝ちのトレードの機会を失うことと強く関連していることは完全にはっきりしているわけではない。

- Fig. 3. Trendiness indicator plotted on a chart of daily E-mini S&P data.
図3.E-mini S&Pの日足チャートに描かれたトレンド度インディケーター
Average True Range Indicator
平均トゥルーレンジ インディケーター
- The last indicator I want to examine is the average true range.
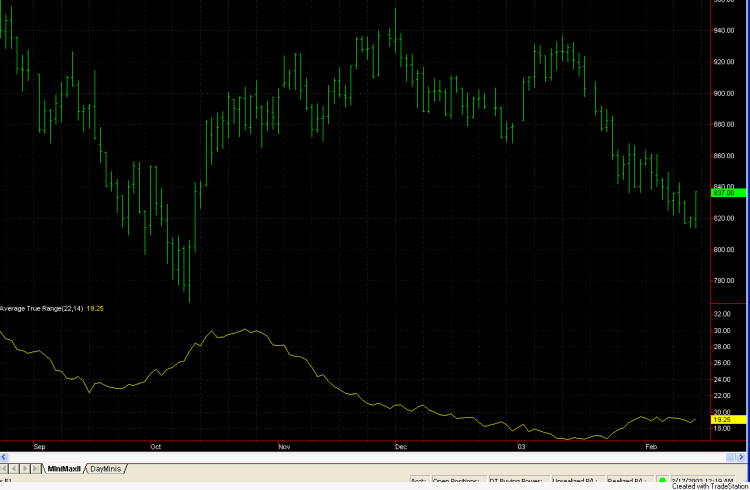
In Fig. 4, the average true range (ATR) is plotted for the daily E-mini S&P using a look-back period of 22 days.
In my opinion, this is the most striking of the three indicators.
The ATR hit a low of 16.7 (E-mini S&P points) on Jan 14th and is currently hovering around 19.
This is the lowest value since Mid-April 2002 and is nearly half the value we saw in mid-October and early August.
最近私が検討したいインディケーターは平均トゥルーレンジである。
図4では、look-back期間に22日を使用したE-mini S&Pの日足チャートに平均トゥルーレンジを表示した。
私個人的には、(ここで紹介している)3つのインディケーターのうち最も注目しているものである。
ATRがE-mini S&Pの安値16.7ポイントを1月14日に示し、現在19付近をさまよっている。
これは2002年4月半ば以降の最安値であり、10月半ばと8月上旬の頃のほぼ半分の値である。
- The ATR has been trending steadily downward since mid-October, only recently appearing to bottom out in January.
While the trading volume of the E-mini S&P is about as high as ever, the daily ranges have been contracting.
One possible interpretation of this is that it represents a lack of conviction among investors and traders.
Whatever the reason, it raises several questions.
Is the lack of volatility temporary?
If it persists, how will it affect trading?
Is there a way to compensate for it?
I try to address the last question below.
ATRは10月半ばからどんどんと下降してゆき、最近1月に底をつけたように見えたところである。
E-mini S&Pでトレードする量がずっと多いのに反して、日足の長さは縮小を続けている。
これについて考えられる1つの解釈は、投資家とトレーダーの信念の欠如を表しているということだ。
どのような理由であれ、この日足の縮小からいくつかの問いが生じる。
ボラティリティの低さは一時的なものなのか?
もし持続するのであれば、トレーディングにどのような影響があるのだろうか?
これによる影響をカバーする方法はあるのだろうか?
私はこの最後の問いについて以下で解決しようと試みた。

- Fig. 4. Average true range plotted on a chart of daily E-mini S&P data.
図4.E-mini S&Pの日足チャートに描かれた平均トゥルーレンジ
Dealing With Declining Volatility
ボラティリティの減少時のトレード
- In this section, I present two methods to adapt a trading system to market volatility.
These methods — the second one in particular — are best suited to breakout systems, although they may be worth investigating for other types of systems as well.
この章では、1つのトレーディングシステムをマーケットのボラティリティに応じて変化させるための2つの方法を紹介する。
これらの方法は(2つめのものは特に)、ブレイクアウトシステムに最も適している。
(これらの方法は、他のタイプのシステムへの利用の検討も同様に価値がある)。
Cycles of Volatility
ボラティリティの周期
- In the November issue of this newsletter (http://www.breakoutfutures.com/Newsletters/Newsletter1102.htm), I discussed using the ATR as a filter for a simple breakout system.
The idea is based on the observation that the ATR is mean reverting; that is, it tends to move back to its average value if it gets too far away from it.
If the ATR is low, it will most likely move higher over the next few bars, and vice-versa if the ATR is high.
This suggests that if you wait until the ATR is low, a breakout trade entering on the next bar has a better chance of developing into a nice trade.
I demonstrated that at least for the simple system I presented, using the ATR in this manner helped improve the overall performance.
このニュースレターの2002年11月の記事(http://www.breakoutfutures.com/Newsletters/Newsletter1102.htm)(またはこのブログの“ボラティリティフィルター”を参照)で単純なブレイクアウトシステムにフィルターとしてATRを使用することを検討した。
このアイデアはATRが巧みに戻る(その平均値へと戻る)という観測をもとにしている。
つまり、もしATRがその平均値より離れすぎていれば、平均値に戻ってくる傾向があるということである。
もしATRが低ければ、ATRの値が数バー先には上昇することが多いように思えるだろう。
もしATRが高ければ今度は反対に数バー先で下降する傾向があるように思える。
これはATRが低くなるまで待ち、次のバーでブレイクアウトによるトレードでエントリーすることが、勝ちのトレードへと発展するよりよいチャンスであると言える。
私の紹介したシンプルなシステムにとっては少なくともこの方法にそってATRを使うことが全体のパフォーマンスを向上させることを証明した。
-
An even better way to take advantage of cycles of volatility is to use the product of volume and ATR. I refer to this product as the “activity.
” For example, a day with a large range and lots of volume is arguably more “active” than a day with the same range but low volume.
Similarly, a day with high volume but a low range is less active than a day with the same volume but a large range.
To provide a “trigger” level, I take the average of the activity over the last N days.
Because the activity is mean-reverting, if the activity is below its average, the activity can be expected to increase over the next few bars.
This can be used as an entry filter to help restrict your trading to more active days.
Specifically, look for a breakout on the next bar if the activity on the current bar is below its N-bar moving average.
In EasyLanguage, this filter can be written as follows:
ボラティリティの周期を利用するさらによい方法は、出来高とATRを使うことである。わたしはこの出来高を“活発さ”として参照する。例えば大きな幅(高値と安値の差)と大きな量(出来高)のある日は、同じ幅で小さい量の日と比べてほぼ間違いなくより“活発”である。同様に、小さな幅で大きな量のある日はより大きい幅で同じ量の日と比べて活発ではない。
“トリガー”となるレベルを与えるために、過去N日の活発さの平均を計算する。活発さが巧みに戻る(その平均値に戻る)ことを考えると、もし活発さがその平均値未満であれば、活発さは数バー後には増加することが予想することができる。あなたのトレーディングをより活発な日に限定する手助けとして、“活発さ”をエントリー用フィルターとして使うことができる。もっと正確に言えば、もし現在のバーでの活発さがそのN本のバーの移動平均よりも下であれば、次のバーでブレイクアウトを期待して待つ、ということである。
イージーランゲージではこのフィルターは次のように書くことができる:
Var: NAct       (30),    { look-back period for activity indicator }

     ActInd     (0);     { value of activity indicator }
ActInd = TrueRange * Volume - Average(TrueRange * Volume, NAct);
If ActInd < 0 then { Place the entry order here; e.g., Buy next bar at H stop; }
- I've tried this filter on several different breakout-type system, and it improved the performance in each case.
It might be worth trying with your own system.
私はこのフィルターをいくつかの異なるブレイクアウトのタイプのシステムに利用を試みた。
その結果は同様にパフォーマンスを向上させた。
あなた自身のシステムにも利用を試みる価値はあるだろう。
Adapting the Breakout Amount to Volatility
ボラティリティにブレイクアウトのための数値を適応させる
- A classic entry method is to enter on a breakout from yesterday's high, low, or close by an amount given by a multiple of the prior day's range or average range.
For example, you might take 50% of yesterday's range, and add it to yesterday's high to define your long entry price.
Since the amount of the breakout is a multiple of the range, this method inherently adapts to the market's volatility, as defined by range or true range.
典型的なエントリーの方法は、昨日の高値または安値か終値に、前日の日足の値幅の倍数または平均値幅の倍数を加えた(または差し引いた)価格をブレイクアウトしたときにエントリーするというものである。
例えば、昨日の値幅の50%を昨日の高値に加えた値をエントリーする価格と定義する。
ブレイクアウトのための数値は値幅の倍数であるため、値幅または真の値幅(トゥルーレンジ)によって定義されたマーケットのボラティリティに応じて、この方法は本質的に変化する。
- However, there's no rule that says this type of simple, linear function of volatility is an adequate way to adapt the size of the breakout to the volatility.
For example, if low volatility is an indication of lack of conviction by traders, we might expect that we'll get more poor quality trades in a low-volatility market as the expected trends fail to materialize.
This is probably what happened to the MiniMax II system in January.
しかしながら、単純なこのタイプ=ボラティリティの1次係数が、ボラティリティに合わせてブレイクアウトのための数値を変えるための妥当な方法であると決まっているわけではない。
例えばもしボラティリティの低さがトレーダーの確信のゆらぎを示すインディケーターであるとするならば、我々はより多くの質の悪い(期待されたトレンドが実現せず失敗に終わるような)トレードをボラティリティの低いマーケットで行ってしまうことが予想される。
これがおそらく1月にMiniMax IIシステムに起きたことなのである。
- Under these conditions, we might want to increase the size of our breakout when the market declines in volatility in order to raise the threshold for entry and avoid trades in a trendless or reversal-prone market.
However, this is exactly the opposite of what will happen when we take our breakout based on a simple fraction of the true range or ATR.
Basing the breakout on a simple fraction of the true range or ATR results in smaller breakouts as the volatility declines.
これらの条件では、マーケットのボラティリティが減少したときにエントリーのためのしきい値を大きくしてトレンドのない状態もしくは反転しやすいマーケットでトレードするのを回避するために、ブレイクアウトのための数値を増やしたくなる。
しかしながらこれは正しくは、われわれがトゥルーレンジかATRのシンプルな分数を基にしたブレイクアウトを使っているときに起きていることとは反対のことなのである。
トゥルーレンジの簡単な分数またはATRをブレイクアウトの基準にすることは、ボラティリティの減少時には小さなブレイクアウトとなるのである。
- Here's one possible solution.
Instead of taking a breakout as a simple fraction of volatility, make the fraction a linear function of volatility, with a larger fraction at low volatility and a smaller fraction at high volatility.
The breakout itself is still calculated the same way, by multiplying the ATR or true range by the fraction.
However, the fraction will vary with the ATR.
As a baseline for comparison, consider the simple breakout system below:
そこで1つの解決法となる可能性のあるものを紹介する。
ボラティリティの単純な分数をブレイクアウトとするかわりに、分数にボラティリティの1次係数を使うのである。
低いボラティリティでは大きな分数を、高いボラティリティでは小さな分数を使うのだ。
ブレイクアウトそれ自体は今までと同じようにATRの倍数またはトゥルーレンジの分数を使って計算する。
しかしながら、この分数はATRとともに変化する。
比較するための基準となる次の簡単なブレイクアウトシステムで考えてみよう:
Input:  EntFrL    (1.0),  { Volatility multiplier for entry }

        EntFrS    (1.0),  { Volatility multiplier for entry }

        MMFrL     (2.0),  { Volatility multiplier for exit }

        MMFrS     (2.0);  { Volatility multiplier for exit }
Var: ATR (0); { Average true range }
ATR = Average(TrueRange, 22);
Buy next bar at H + EntFrL * ATR stop;
Sell short next bar at L - EntFrS * ATR stop;
If MarketPosition = 1 and C > EntryPrice and BarsSinceEntry >= 1 then
Sell this bar at close;
If MarketPosition = -1 and C < EntryPrice and BarsSinceEntry >= 1 then
Buy to cover this bar at close;
If MarketPosition = 1 then
Sell next bar at EntryPrice - MMFrL * ATR stop;
If MarketPosition = -1 then
Buy to Cover next bar at EntryPrice + MMFrS * ATR stop;