- Because the fixed ratio method depends on account size, how it performs compared to the fixed fractional method over a series of trades depends on where the drawdowns occur.
If the biggest drawdown occurs late in the sequence of trades, the fixed ratio method will do well because the fastest increase in the number of contracts will have occurred during the most profitable period.
On the other hand, if the biggest runup in equity occurs late in the sequence of trades, the fixed fractional method will do better because it will increase the number of contracts more quickly at that point, whereas the rate of increase in the number of contracts with the fixed ratio method will have already slowed.
なぜならば、固定比率法は資金の大きさに依存しているからであり、一連のトレードでこの方法が固定分割法と比べてどのように実行するかは、いつドローダウンが発生するのかに依存する。
もし最大のドローダウンが1連のトレードの後半に発生したならば、枚数の最も早い増加は最も利益のある期間に発生するために固定比率法はうまくいく。
一方でもし最大の資産成長が後半に発生した場合、固定比率法での枚数の増加の割合がすでに遅くなっているのに対し、固定分割法が、その時点でより早く枚数を増加させるためよりうまくいく。
- As an example, consider the following equity curve from a real sequence of trades.
I adjusted the delta for the fixed ratio method and the fixed fraction for the fixed fractional method so that the worst-case percentage drawdown was the same in each case.
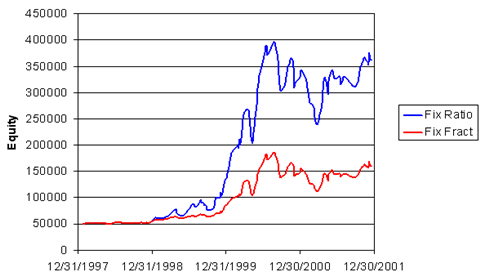
Fig. 1 shows the equity curves for both methods when the trades occur in their historical sequence.
The fixed ratio method clearly delivers superior performance.
The net profit is much higher for the same maximum drawdown.
Note that the primary run up in equity occurred early in the sequence of trades.
The fixed ratio method was more aggressive early on when it mattered the most.
一例として、実際の1連のトレードによる下記の資産成長曲線について考えてみよう。
私は固定比率法のデルタと固定分割法の固定分割値を、最悪のケースのパーセンテージドローダウンがどちらの方法でも同じになるように調整した。
図1はトレードの発生時期を横軸にとった両方の方法の資産成長曲線を示している。
固定比率法はあきらかによりすぐれたパフォーマンスを達成している。
純利益(ネットプロフィット)はおなじ最大ドローダウンにたいし、より高いものとなっている。
資金の最初の上昇が初期の段階で起きていることに注意してほしい。
固定比率法はそれがもっとも重要であるときの早い時期により積極的である。

- Figure 1. Equity curve for historical sequence of trades using fixed fractional (“Fix Fract”) and fixed ratio (“Fix Ratio”) position sizing.
The maximum peak-to-valley drawdown is the same (in percentage terms) in each case.
図1.固定分割(”Fix Fract”)と固定比率(”Fix Ratio”)のポジションサイジングを使ったトレードでの資産成長曲線。
最大ピークトゥバレィ ドローダウンは(パーセンテージで)同じにした。
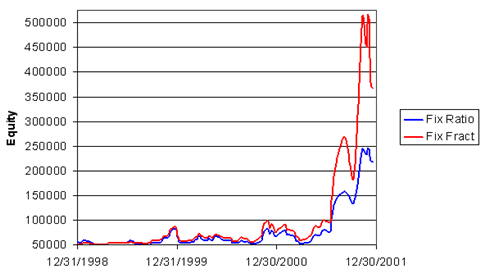
- However, if we randomize the trade sequence, as in Fig. 2, the opposite result is possible.
These are the same trades as in Fig. 1, just in a different order.
Again, the parameters for the two methods have been adjusted to produce the same maximum peak-to-valley percentage drawdown.
In this case, the fixed fractional method generates a much higher return for the same drawdown.
In this sequence of trades, the run up in equity occurred late in the sequence.
As a result, the fixed fractional method was more aggressive than the fixed ratio method in increasing the number of contracts late in the sequence when it counted most.
しかしながら、もし図2のようにこの1連のトレードの順番をランダムに並び替えると、反対の結果が起こり得る。
これらは図1でのトレードと同じもので、その順序が異なるだけである。
再び、この2つの方法(固定比率法と固定分割法)のパラメータを最大ピークトゥバレィ パーセンテージ ドローダウンが同じとなるように調整した。
この場合、固定分割法は同じドローダウンで比べるとより高い収益を生み出す。
このトレードの順序では、資産の上昇は一連のトレードの後半に発生している。
結果としては、それがほとんど計算するとき、後半に枚数を増やす固定分割法が固定比率法よりもより積極的だった。

- Figure 2. Equity curve for randomized sequence of the same trades as in Fig. 1 using fixed fractional (“Fix Fract”) and fixed ratio (“Fix Ratio”) position sizing.
The maximum peak-to-valley drawdown is the same (in percentage terms) in each case.
図2.図1で固定分割(”Fix Fract”)と固定比率(”Fix Ratio”)のポジションサイジングを使って行ったトレードの順序をランダムに並べ替えたときの資産成長曲線。
最大ピークトゥバレィ ドローダウンは(パーセンテージで)同じにした。
- For any sequence of trades, one method will be better than the other.
However, even if we have a good idea of the distribution of our trades, the sequence is always unknown.
As I discussed in last month’s newsletter, one way to deal with the consequences of not knowing the sequence of a series of trades is to use the Monte Carlo method.
With the Monte Carlo method, we can perform an analysis over many different, randomly chosen trade sequences and evaluate the results in terms of statistics.
In effect, this is a way to convert the uncertainty of the trade sequence into a quantified (if probabilistic) result.
This method might be able to tell us whether the fixed fractional or fixed ratio method is better for a given series of trades.
どのようなトレードの順序のときでも、1つの方法が他方よりもいい結果を生じるだろう。
しかし、我々がトレードの分布についていいアイデアをもっていたとしても、トレードの順序はいつもわかっていない。
前回のニュースレターで私が述べたように、一連のトレードの順序を知らないことについての結果でトレードする1つの方法はモンテカルロ法を使うことである。
モンテカルロ法を使って我々は多くの異なるランダムに並び替えられたトレードを分析することは可能であり、統計項目の結果を向上させることができる。
事実上、これはトレード順序の不確かさを定量化された(ある程度確実であるならば)結果へと変換する方法である。
この方法が固定分割法と固定比率法のどちらが与えられた一連のトレードにとっていいのかを知ることができるのかもしれない。
- We can take this analysis one step further by reconsidering the equation presented above for the fixed ratio method.
Notice the 0.5 exponent in the equation for the number of contracts, N, in the fixed ratio method.
Consider what we would get if the 0.5 was replaced with 0.
In that case, we get N = 1. In other words, an exponent of zero represents fixed contract trading with one contract per trade.
What if the exponent has the value 1?
In this case, we find that the number of contracts, N, is proportional to the profit.
This is the basis of fixed fractional trading.
In other words, an exponent of 1 represents fixed fractional position sizing.
我々は上記した固定比率法の式を考え直すことで、この分析をさらに一歩すすめることができる。
この式の建て玉枚数のための指数0.5、Nについて注目してほしい。もし0.5が0に置き換えられたときどうなるのかを考えてみる。
この結果、N = 1となる。
言い換えれば、指数0は1回につき1枚での固定枚数でのトレードということである。
この指数が1とはいったい何を示すのか?
このケースでは建て玉枚数Nが利益に比例している。
これは固定分割トレーディングの基礎である。
言い換えれば、指数1は固定分割ポジションサイジングを表しているのである。
- There’s nothing preventing us from choosing other exponent values as well.
With this in mind, we can write a more generalized form of the position sizing equation as:
同様にほかの指数を選択することから我々を妨げるものはない。
これを念頭において、我々はポジションサイジングの式をより一般的なものとして次のように書くことができる:
N = 0.5 * [1 + (1 + 8 * Profit/delta)^m]
- where the exponent m can vary from 0 to any positive number we like. With m = 0, we get fixed contract trading.
With m = 1, we have the equivalent of fixed fractional trading.
m = 0.5 gives us fixed ratio trading.
ここで指数mは0から任意の正の数字へと変化することができる。
m = 0 では固定枚数トレーディングとなる。
m = 1 は固定分割トレーディングに相当する。
m = 0.5 は固定比率トレーディングとなる。
- Any value of m less than 1 (e.g., 0.5 or 0.10) will increase the number of contracts more slowly for larger account equity values.
Values of m larger than 1 will increase the number of contracts more quickly as the account equity increases.
At m = 1 (i.e., fixed fractional), the rate of change in the number of contracts is independent of account size.
1未満のすべての値(0.5や0.1など)はより大きな資金の額ではよりゆっくりと建て玉枚数を増加させる。
1より大きな数値は資金の増加に伴いより早く枚数を増加させる。
m = 1 では(すなわち固定分割である)、枚数の変化の割合は資金の額には依存しない。
- We might expect that for any sequence of trades, there’s an “optimal” value of m.
By optimal, I mean there’s one value of m that produces the greatest return for a given maximum drawdown.
As noted above, since we don’t know the sequence of trades to expect in the future, calculating this optimal m for a historical sequence of trades is probably a pointless exercise.
However, it might be interesting to use the Monte Carlo method to see what this optimal m would be based on the statistical results of the Monte Carlo simulation.
I’ve yet to do that analysis, however.
我々はすべてのトレードの順序にとって、1つの“最良な”mの数値があることを期待している。
最良な数値とは、最大ドローダウンに対して最大の利益を生む【m】の数値を意味している。
上記したように、我々は将来に予想されるトレードの順序がわからないため、過去のトレード順序にとっての最良mを計算することはおそらく無意味な行動である。
しかしながら、モンテカルロシミュレーションの統計的結果に基づいた最良のmを調べるためにモンテカルロ法を使うことは面白いことだ。
それでもわたしはまだこの分析を続けている。
参考文献:
1.Ralph Vince, Portfolio Management Formulas, John Wiley & Sons, Inc., New York, 1990.
2.Ryan Jones, The Trading Game, John Wiley & Sons, Inc., New York, 1999.
終わり
この内容は下記のページを作者の許可を得て翻訳紹介しています。
http://www.breakoutfutures.com/Newsletters/Newsletter0703.htm