- The resistance level is then the price above the current bar’s high for which the sum of squares is smallest.
The support level is the price below the current bar’s low for which the sum of squares is smallest.
レジスタンスレベルは現在のバーの高値より高いプライスで、2乗の合計が最も小さくなるものである。
サポートレベルは現在のバーの安値より低いプライスで、2乗の合計が最も小さくなるものである。

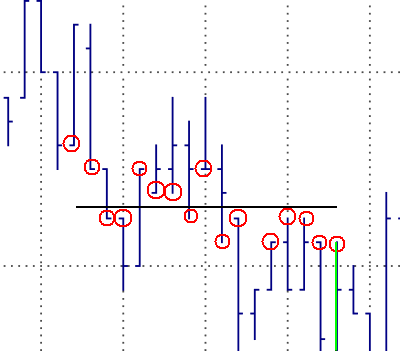
- Fig. 2. Fitting a line to the price bars.
図2.プライスバーにラインを合わせている様子
- Fig. 2. illustrates the sum-of-squares process for a given price level. The horizontal line is a potential resistance level for the price bar colored green.
The prices used in the sum of squares calculation are circled in red.
Notice that one of the bars does not have a red circle on either its high or low.
This is because the closest price on the bar is farther than Y points from the horizontal line.
The sum of squares for this horizontal price level is the sum of the squares of the distances between the circled prices and the horizontal line.
図2は 与えられたプライスレベルで2乗の積算の工程を表したものである。
水平ラインは緑色のプライスバーの潜在的なレジスタンスレベルである。
2乗の積算の計算に使用されたプライスは赤い丸で表示した。
高値と安値のどちらにも赤い丸のないバーが1つあることに気づくだろう。
これはこのバー上の最もラインに近いプライスが水平ラインからYポイント以上に大きく離れているためである。
水平プライスレベルのための2乗の合計は、丸で囲まれたプライスと水平ラインとの間の距離を2乗したものの合計である。
- I programmed the calculation of the support and resistance levels into an EasyLanguage function called SupRes2. The EasyLanguage code is shown below.
私はこのサポートとレジスタンスレベルの計算をイージーランゲージ関数としてプラグラム化し、SupRes2と名づけた。イージーランゲージのコードは次のとおりである。
{
Function: SupRes2 (“Support/Resistance”)
Locate the nearest price levels of support and resistance.
Returns: Average of support and resistance levels; Also, the
support and resistance levels are returned through the argument
list.
Michael R. Bryant
Breakout Futures
www.BreakoutFutures.com
Copyright 2003 Breakout Futures
Feb 24, 2003
}
Input: NBars (NumericSimple), { # bars to lookback in search }
PriceRnge (NumericSimple), { # points to examine above/below close }
PFilter (NumericSimple), { Include high/low within PFilter points }
MinPoints (NumericSimple), { min # points for a fit }
SupPrice (NumericRef), { located support price }
ResPrice (NumericRef); { located resistance price }
Var: iPrice (0), { price at current level }
DtoLow (0), { distance from line to low }
DtoHigh (0), { distance from line to high }
Sum (0), { sum of weights }
NormSum (0), { normalized sum }
MinSum (999999),{ max sum of weights }
NPoints (0), { # points in sum }
SupportP (0), { best support price }
ResistP (0), { best resistance price }
NPInc (0), { number of price increments above/below close }
istart (0), { first increment to start at }
ip (0), { loop counter of price increments }
ib (0); { loop counter for bars }
NPInc = PriceRnge/(MinMove/PriceScale);
istart = IntPortion(NPInc/3);
{ Search for resistance; loop over prices above close }
MinSum = 999999;
ResistP = MaxList(High, ResPrice);
For ip = istart to NPInc Begin
iPrice = Close + ip * (MinMove/PriceScale);
Sum = 0;
NPoints = 0;
{ Loop over bars }
For ib = 1 to NBars Begin
{ Add up sum of squares of distances to price line }
DtoLow = AbsValue(L[ib] – iPrice);
DtoHigh = AbsValue(H[ib] – iPrice);
If DtoLow <= DtoHigh and DtoLow <= PFilter then Begin
NPoints = NPoints + 1;
Sum = Sum + Square(DtoLow);
end
else If DtoHigh < DtoLow and DtoHigh <= PFilter then Begin
NPoints = NPoints + 1;
Sum = Sum + Square(DtoHigh);
end;
end; { loop ib }
{ Record iPrice if sum is lowest so far }
If NPoints >= MinPoints then Begin
NormSum = SquareRoot(Sum/NPoints);
If NormSum < MinSum then Begin
MinSum = NormSum;
ResistP = iPrice;
end;
end;
end; { loop ip }
ResistP = MaxList(High, ResistP); { make sure resistance >= high }
{ Search for support; loop over prices below close }
MinSum = 999999;
SupportP = MinList(Low, SupPrice);
For ip = istart to NPInc Begin
iPrice = Close – ip * (MinMove/PriceScale);
Sum = 0;
NPoints = 0;
{ Loop over bars }
For ib = 1 to NBars Begin
{ Add up sum of squares of distances to price line }
DtoLow = AbsValue(L[ib] – iPrice);
DtoHigh = AbsValue(H[ib] – iPrice);
If DtoLow <= DtoHigh and DtoLow <= PFilter then Begin
NPoints = NPoints + 1;
Sum = Sum + Square(DtoLow);
end
else If DtoHigh < DtoLow and DtoHigh <= PFilter then Begin
NPoints = NPoints + 1;
Sum = Sum + Square(DtoHigh);
end;
end; { loop ib }
{ Record iPrice if sum is lowest so far }
If NPoints >= MinPoints then Begin
NormSum = SquareRoot(Sum/NPoints);
If NormSum < MinSum then Begin
MinSum = NormSum;
SupportP = iPrice;
end;
end;
end; { loop ip }
SupportP = MinList(Low, SupportP); { make sure support <= Low }
SupPrice = SupportP;
ResPrice = ResistP;
SupRes2 = (SupportP + ResistP)/2.;
- I also created an indicator based on the SupRes2 function to plot the support and resistance levels.
The code for the indicator is shown below.
私はまたSupRes2関数を基にしてサポートレベルとレジスタンスレベルをチャートに描くインディケーターも作成した。
このインディケーターのコードは次のとおりである。
{
Indicator: SupRes Indicator-2
Plot the support and resistance given by the SupRes2 function.
Michael R. Bryant
Breakout Futures
www.BreakoutFutures.com
Copyright 2003 Breakout Futures
Feb 24, 2003
}
Inputs: NBars (30), { # bars to lookback in search }
PriceRnge (3), { # points to examine above/below close }
PFilter (1.0), { points this close to line }
MinPoints (4); { need at least this many points in fit }
Var: SupPrice (C), { located support price }
ResPrice (C); { located resistance price }
{ Call SupRes function to find nearest support/resistance }
Value1 = SupRes2(NBars, PriceRnge, PFilter, MinPoints, SupPrice, ResPrice);
Plot1(SupPrice, “Support”);
Plot2(ResPrice, “Resistance”);
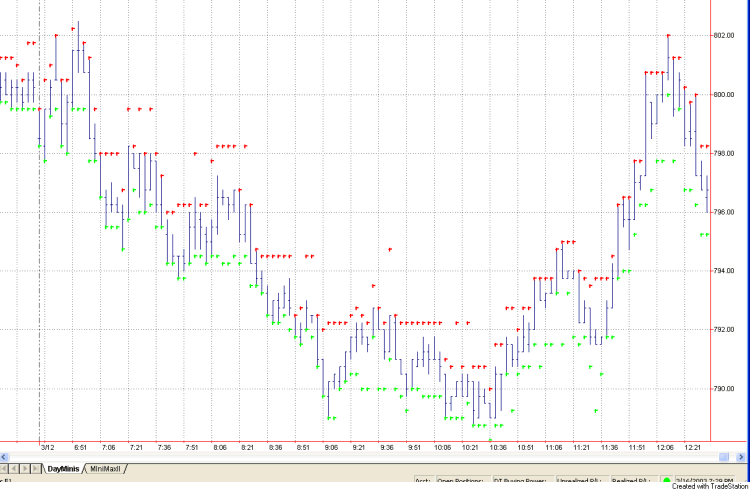
- In Fig. 3, I show how the indicator works for the same price chart shown in Fig. 1.
I used the following input parameter values: 30, 2.25, 0.75, 4.
The support prices are in green and the resistance levels in red.
During downtrending markets, the support levels tend to stay close to the price bar lows because none of the nearby price bars have prices lower than the most recent bar’s low.
Similarly, in uptrending markets, the resistance levels stay near the highs.
The SupRes2 function could be employed in a trading system in a number of different ways, such as (1) to identify the trend based on whether support and resistance levels are rising or falling, and (2) to trigger entries and/or exits at the identified support and resistance levels.
図3では、図1で見せたのと同じプライスチャートにインディケーターがどのように機能するのかを描いた。
私は次の値を入力パラメーター数値に用いた。:30,2.25,0.75,4
サポートレベルのプライスが緑色、レジスタンスレベルが赤色である。
マーケットが下降トレンドにある時、サポートレベルはプライスバーの安値近くにある傾向がある。
なぜなら最近のバーの安値の大部分よりも低い値をもったプライスバーが近くに(30本バー以内に)ないためである。
同じように、マーケットが上昇トレンドにある時、レジスタンスレベルは高値近くにある。
SupRes2関数はいくつかの異なる方法でトレーディングシステムに使うことが可能だろう。
(1)サポートとレジスタンスレベルが上昇しているのか下降しているのかということに基づいてトレンドを識別する、
(2)エントリーと(または)エグジットのトリガーとして識別されたサポートとレジスタンスレベルを使う、
といったように、である。

- Fig. 3. SupRes Indicator plotted on a 3 minute chart of E-mini S&P data.
図3.E-mini S&Pの3分チャートデータに描いたSupRes2インディケーター
- The SupRes2 function illustrates how a visual task like identifying a support or resistance level on a
price chart can be systematized.
I’ll leave it to you to incorporate these levels into a trading system.
SupRes2関数がプライスチャート上でサポートレベルまたはレジスタンスレベルを識別するような視覚的な作業をどのように順序立てて行えるのかを図に表している。
これらのレベルをトレーディングシステムにとりいれるかどうかはあなたに任せよう。
終わり
この内容は下記のページを作者の許可を得て翻訳紹介しています。
http://www.breakoutfutures.com/Newsletters/Newsletter0303.htm