完成されたシステムはマーケットデータに過剰に最適化されていないのか、システムの評価方法について統計学の最小2乗回帰の観点から考えてみた。
The Breakout Bulletin
ブレイクアウト会報
The following article was originally published in the May 2003 issue of The Breakout Bulletin.
以下の記事はブレイクアウト会報の2003年3月号に掲載されたものです。
The Analogy of System Optimization to Least Squares Regression
システム最適化と最小2乗回帰の共通点
-
Last month I presented a simple statistical test based on confidence intervals to help evaluate the profitability of a trading system based on its trade history. One caveat to that test was that it can’t tell us if the system has been over-fit to the market and therefore not likely to perform well in the future. This month, I’m going to try to address this problem by way of analogy to least squares regression.
先月私は、トレーディングシステムをそのシステムのトレード成績から評価するのに役立つ「信頼区間に基づいた単純な統計的テスト」を紹介した。
このテストの注意事項の1つは
「システムが市場に対して過剰な適合をしているかどうか」をテストの結果が教えてくれないため、将来においてシステムがうまく機能しないかもしれない」、
ということである。
今月、私は最小2乗回帰との共通点を用いた方法によりこの問題に取り組もうと思う。
-
Some traders believe the only good optimization is no optimization. Others re-optimize their systems every week. The wide diversity of opinions on the subject is reflective of the lack of concrete answers to the questions that system optimization raises. The primary question is whether optimization leads to systems that are “over-fit” to the market.
あるトレーダー達は「一度きりの最適化は最適化ではない」と信じている。
彼らは自分たちのシステムの最適化を毎週行っている。
最適化についての広く様々な見解があるということは、システムの最適化の際に出てくる疑問についての具体的な答えが欠けていることを意味する。
この疑問の中で主なものは「最適化の作業が、システムを市場に過剰に適合されたものへと導くのかどうか」、である。
-
Any profitable trading system is “fit” to the market in the sense that it must be aligned with some underlying characteristic of the market to be successful.
利益を生むいかなるトレーディングシステムも、
「成功するためには(対象となる)その市場の潜在的なある特性を用いて調節されるべきである」
という考えの下で、市場へ「適合」されている。
-
I use the phrase “over-fit” to suggest that the degree of fit is so tight that if future market behavior deviates even slightly from the past, the system will become out of sync with the market and will not be profitable.
適合する度合いがあまりに強いと、もし将来の市場の動向が過去からわずかにそれるだけでそのシステムは市場との同調から外れ利益を生まないだろういう意味で、私は「過剰に適合」というフレーズを使用している。
-
From this point of view, the key to optimization is to fit the system to the market without over-fitting it. A system that is properly optimized will be able to handle normal variations in market behavior, whereas an over-fit system will not.
この観点から、最適化の鍵はシステムを市場に過剰とならないように適合させることである。
適正に最適化されたシステムは市場の動向の中の通常の変動を処理できるが、これに対して過剰に適合されたシステムはそうはならない。
-
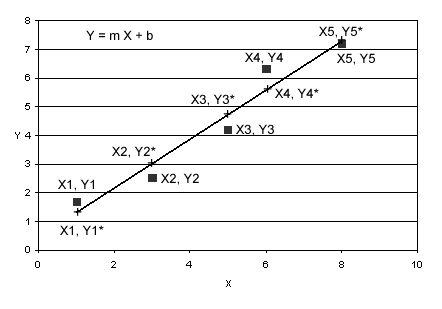
One way to understand the difference between fitting and over-fitting is to look at the process of system optimization as a kind of least squares regression; i.e., curve fitting. Consider the standard least squares curve fitting problem shown in Fig. 1. The problem is: determine the values m (slope) and b (y intercept) for the equation y = m*x + b that best fits the equation to the data points (x1, y1), (x2, y2), …, (x5, y5).
適合と過剰な適合の違いについて理解する1つの方法が、最小2乗回帰の1種としてシステム最適化の過程を観察することである。
すなわちカーブフィッティングのことだ。
図1に掲載した標準的な最小2乗回帰のカーブフィッティングの問題について考えてみる。この問題は、データポイント(x1, y1), (x2, y2), …, (x5, y5)にフィットするようにy = m*x + bの式のm(傾き)とb(y切片)の値を決定することである。

-
Figure 1. Fitting a straight line to a set of data points. The line is given by the equation y = m*x + b, where m is the slope and b is the y-intercept. The data points are given by (x1, y1), …, (x5, y5). At the x value of each data point, the corresponding value of y that lies on the line is given by yi*; e.g., y1*, y2*, etc. The line is fit the to the data points by minimizing the sum of the squares of the differences between yi and yi*.
図1.一連のデータポイントに直線を適合させる。
この線は式 y = m*x + bで表され、mは傾きbはy切片である。
データポイントは(x1, y1), (x2, y2), …, (x5, y5)である。
それぞれのデータポイントのxの値に対応するこの線上のyの値は、yi*(例えばy1*, y2*など)として与えられる。
この線はyiとyi*の差各々を2乗したものの合計が最小となるようにすることでデータポイントに適合される。
-
In the least squares method, we calculate the value of y that lies on the curve y = m*x + b at each data point, x (x1, x2, etc). For example, at x1, the y value of the curve is y1*. We then calculate the difference between the curve, y1*, and the data point, y1 and take the square of this difference. The sum of all such squares represents the total deviation of the curve from the data points. The values of m and b that minimize this sum give us the line that best fits the data points. This is the least squares regression method for fitting a line to a set of data points.
最小2乗法で、我々はそれぞれのデータポイントx(x1、x2など)に対応した(曲)線y = m*x + bのyの値を計算する。
例を挙げるとx1ではこの(曲)線のyの値はy1*である。
そしてこの(曲)線のy1*とデータポイントy1の差を計算し、さらにこの差の2乗を計算する。
これら2乗した値すべてを合計したものがデータポイントからの(曲)線の総偏差となる。
この合計値を最小とするmとbの値が、データポイントにもっともよく適合する線を表す。
これが一連のデータポイントに線を適合させるための最小2乗回帰法である。